Kenya, like many other countries, faces its own set of challenges related to biodiversity conservation. These challenges arise from ever-increasing land and sea use changes, which include among others habitat loss due to agricultural expansion, infrastructure development, and urbanization, as well as over exploitation of natural resources.
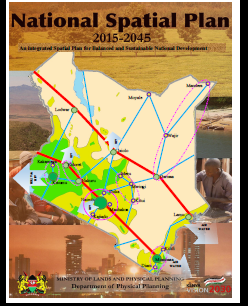
In order to address these challenges, Kenya has developed the National Spatial Plan, spanning from 2015 to 2045, where all Counties (47) borrow heavily in preparation of County Spatial Plans. The primary aim is to promote well-structured, coordinated, sustainable, and balanced development across the country. This plan acts as a roadmap for future land and sea use activities, thereby providing a spatial framework to enhance national organization and connectivity among different land uses both at the National and County levels throughout Kenya. The national target is based on the understanding that Kenya's environment, economy, and cultural identity all rely on the well-being of its ecosystems. To safeguard its natural heritage and create a sustainable and prosperous future for everyone, the target aims to achieve this by advocating for comprehensive, biodiversity inclusive and participatory spatial planning, efficient resource management, and upholding the rights of indigenous groups and local communities, both at the national and county levels
Headline indicator(s)
|
Targets |
Description |
Baseline Data |
Comments |
|
Global target 1
Plan and Manage all Areas to Reduce Biodiversity Loss |
Ensure that all areas are under participatory, integrated and biodiversity inclusive spatial planning and/or effective management processes addressing land- and sea-use change, to bring the loss of areas of high biodiversity importance, including ecosystems of high ecological integrity, close to zero by 2030, while respecting the rights of indigenous peoples and local communities. |
|
|
|
National target
By 2030, Plan and Manage all Areas to reduce Biodiversity Loss
|
Ensure that by 2030 all areas are under biodiversity inclusive participatory spatial planning and effectively managed, addressing land and sea use change to reduce biodiversity loss while respecting the rights of indigenous people and local communities. |
|
|
|
Alignment with global goals and targets |
Goal A, B Target: 2, 3, 4, 5, 6, 7, 8, 10, 12, 14 |
|
|
|
Degree of alignment (high, medium, low) * |
Goals A &B - High Target: 2,3,4,7,8,10,12 - High Target: 6 & 14: - Medium. Target 5 – Low. |
|
|
|
Headline indicator(s) |
A.1 Red List of Ecosystems The Red List of Ecosystems (RLE) is a global framework developed by the International Union for Conservation of Nature (IUCN) to assess the risk of ecosystem collapse. In Kenya, this framework has been applied to evaluate the conservation status of various ecosystems, with notable attention given to its coral reefs and mangroves, among others. Below is an overview based on the latest available information as of March 02, 2025.
|
|
Not available at national level
|
|
|
A.2 Extent of natural ecosystems
|
26% |
Includes: - 20% Protected and conserved Areas: 23 National Parks, 28 National Reserves, 5 National Sanctuaries, 4 Marine National Parks,6 Marine Reserves and 160+Conservancies -1% mangrove forest (2017). A mangrove cover loss of 0.15% was estimated per year between 2010 and 2016 indicating a trend of gradual reduction in loss of forest cover. 3% wetlands 2% (12,341.73km sq) lakes |
|
|
1.1 Percent of land and seas covered by biodiversity-inclusive spatial planning* |
100% |
National spatial plan https://vision2030.go.ke/wp-content/uploads/2018/05/National-Spatial-pl… |
|
Component indicator |
Priority retention of intact/wilderness areas |
|
The discussion centered on the definition of retention of intactness. Members also pointed out that a possible approach would be to consider the protected areas as well as gazetted forests. The debate was are we measuring intention or where we currently are. It was agreed that this data cannot be compiled through a rapid assessment. |
|
Complementary indicator(s) |
Percentage of spatial plans utilizing information on key biodiversity areas |
27% |
We are using counties as the basis. This figure is based on 13 out of 47 counties that have spatial plans. The 13 counties are Kajiado, Bomet, Lamu, Kilifi, Makueni, Kericho, Baringo, Bungoma, Nakuru, Meru, Mombasa, Nairobi, and Kakamega |
|
|
Habitat patches located within marine protected areas or integrated marine and coastal area management (IMCAM)
|
|
|
|
|
Other spatial management plans (not captured as IMCAM or marine spatial planning in 14.2.1)
|
55% |
Active 70% National Parks and Reserves have Management Plans, 40% of conservancies have Management Plans |
|
|
Proportion of transboundary basin area with operational arrangement for water cooperation
|
34.85% |
|
|
|
Proportion of total land area that is under cultivation
|
13% |
IPCC Classification Ref: USGS/RCMRD/DRSRS/KFS |
|
|
Extent of natural ecosystems by type
|
7 |
Marine and coastal, Savannah, Mountain,wetlands, Forest and woodlands, Urban, freshwater - Note: size will be included by acreage |
|
Other national indicator(s) |
Number of counties implementing the national spatial plan
|
47 |
National spatial plan https://vision2030.go.ke/wp-content/uploads/2018/05/National-Spatial-plan.pdf |
|
|
Number of counties with spatial plans utilizing information on key biodiversity areas |
|
|
|
|
Number of management plans for protected and conserved areas |
|
|
|
|
Land degradation index
|
45 |
State of Environment Report 2023 |
|
|
Land use and land cover (water, forest, grassland, wetlands, wildlife, livestock etc.)
|
|
|
|
|
Number of key biodiversity areas under conservation
|
68 |
Kenya National Biodiversity Threat Assessment -67 are Important Bird Areas (IBA) and 6 are Alliance for Zero Extinction (AZEs) Since 1980, there has been a 7.5% increase in the coverage of KBAs within protected areas (PAs) in Kenya |
|
|
Number of green spaces |
|